Job Qualification Matching and Lexical Analysis

Goal
I read an article on HN about FAANG companies. As some of the top places to work, I wondered if my qualifications matched up with roles there. Since I've been a Mac user since 1992 and an Apple ][ user since I was a baby, I figured I'd grab a bunch of roles from Apple's career site and figure out which ones would be the best match for my skillset.
Prerequisites
- Know a bit of Python
- Sign up for Apple's career site
- Favourite a bunch of roles you're interested in
Get the roles
Since the focus of this article is on lexical analysis, I'll just quickly go through how I got the role qualifications.
- The URL for getting your roles is
https://jobs.apple.com/app/api/v1/js/talent/YOUR_TALENT_ID/roles. I grabbed this from the Chrome inspector when on the main job site. - The URLs for each role isn't sent in the JSON, but we know the structure:
https://jobs.apple.com/en-us/details/POSITION_ID/POSTING_TITLE. Just need to change the spaces to dashes in thepostingTitlewith a simplestring.replace(" ", "-").
response = requests.get('https://jobs.apple.com/app/api/v1/js/talent/YOUR_TALENT_ID/roles', headers=headers, cookies=cookies)

# where we store the URLs for each role we're interested in
role_urls = []

for i in response.json():
    url = "https://jobs.apple.com/en-us/details/%s/%s/" % (i["positionID"], i["postingTitle"].replace(" ", "-"))
    role_urls.append(url)
- Once we've got a list of role URLs, we iterate over each and get the detailed role and parse out the title (
jdPostingTitle), summary (jd-job-summary), and qualifications (jd-key-qualifications). The nice thing about this detailed view is that Apple follows the jobPosting schema from schema.org. - Qualifications come in as an HTML unordered list, which is easily converted to a Python list thanks to Beautiful Soup.
- I created a
Roleclass that simply contains those three attributes, which I instantiate in the last line.
# First, get the page itself
r = requests.get(url)

# print(r.text)

soup = BS(r.text, features="html.parser")

title = soup.find(id="jdPostingTitle")
summary_raw = soup.find(id="jd-job-summary")
for span in summary_raw.contents:
    summary = span.contents[0] # no need for loop

# more difficult
# need to parse each item in the list and extract the text
# then add to a qualifications list
qualifications_raw = soup.find(id="jd-key-qualifications")
qualifications = []
for ul in qualifications_raw.contents:
    for li in ul.findAll('li'):
        for text in li:
            #print(text.contents[0])
            qualifications.append(text.contents[0])


role = Role(title=title.contents[0], summary=summary, qualifications=qualifications)
- To print these:
print("TITLE: %s\n" % role.title)
print("QUALIFICATIONS:")
for item in role.qualifications:
    print(item, end="\n\n")
- Which would look like this (truncated for legibility):
TITLE: Program Manager

QUALIFICATIONS:
Goal oriented, highly motivated and able to work under minimal supervision in a cross-functional environment at detailed levels whilst taking account of interdependencies at higher levels.

Strong background in system implementation project management using proven software development techniques.

Excellent presentation, product demonstration, and writing skills.

Ability to clearly communicate/position the specifics of the product vision to the market.

Motivated, collaborative, dynamic, creative and results-oriented.
Lexical Analysis
My plan was to take each qualification from each job posting and compare them to the qualifications of every other job posting I pulled. I wanted to see which qualifications were unique for each role and which were overlapping with other roles.
Now I am a total newbie to lexical analysis and had no clue how to compare two sentences. I ran across a couple of algorithms for this: Levenshtein Distance and Jaccard Index. They're both used to measure similarity of two strings or sets but completely differ in their respective algorithms. I wasn't sure which one to go with so I implemented both (using Distance library) out of curiousity. (l = Levenshtein, j = Jaccard.) (Thanks to this tutorial.)
def compare_two_sentences(s1, s2):

    s1_filt = filter_stopwords(s1)
    s2_filt = filter_stopwords(s2)

    l = distance.levenshtein(s1_filt, s2_filt)
    j = nltk.jaccard_distance(set(s1_filt), set(s2_filt))

    return l, j
For both Levenshtein and Jaccard, numbers closer to 0 mean the two sentences are more closely related. I also filtered out the most common words (stopwords) to increase the percentage of keywords in each comparison.
The idea was to produce a result like this:
s1: Ability to participate in and facilitate requirements brainstorming sessions.
s2: A keen ability to filter and distill substantial information for the right audience.

levenshtein: 53
jaccard: 0.20833333333333334
Finally, I iterated through each qualification in each role and compared them with all qualifications in every other role:
for role in roles:
    for comparison in roles:
        if role.title == comparison.title:
            pass # no point in matching if they're the exact same role
        else:
            for qx in role.qualifications:
                for qy in comparison.qualifications:
                    l, j = compare_two_sentences(qx, qy)
Results
Sentence 1: You have working understanding of project management tools and methodologies.
Sentence 2: Solid experience in both product management and product marketing. Education apps experience helpful.
Levenshtein: 64, Jaccard: 0.269
Sentence 1: A keen ability to filter and distill substantial information for the right audience.
Sentence 2: Ability to participate in and facilitate requirements brainstorming sessions.
Levenshtein: 53, Jaccard: 0.208
Okay, I guess this is getting closer.
Sentence 1: A keen ability to filter and distill substantial information for the right audience.
Sentence 2: Ability to filter and distill meaningful information for the right audience
Levenshtein: 18, Jaccard: 0.0909 👍
Here we go! Two qualifications from different job postings that are not exactly the same, but incredibly similar.
Rather than looking through the entire 2500-line output, I set the comparisons to only print if the Levenshtein score was below 30 and Jaccard was below 0.15.
Sentence 1: Ability to communicate thoughtfully, leveraging problem-solving skills and a learning mindset to build long-term relationships
Sentence 2: Goal oriented, highly motivated and able to work under minimal supervision in a cross-functional environment at detailed levels whilst taking account of interdependencies at higher levels.
Levenshtein: 122, Jaccard: 0.142
Sentence 1: Goal oriented, highly motivated and able to work under minimal supervision in a cross-functional environment at detailed levels whilst taking account of interdependencies at higher levels
Sentence 2: Goal oriented, highly motivated and able to work under minimal supervision in a cross-functional environment at detailed levels whilst taking account of interdependencies at higher levels.
Levenshtein: 2, Jaccard: 0.037 👍
So it appears that anything with a Levenshtein distance < 20 or a Jaccard distance < 0.1 is similar enough to be the same qualification. With that in mind, let's graph it.
Graphing
I figured this would be pretty simple to plug into library that can spit out a nice-looking network graph. However, it's not quite so simple.
To create the graph, I used NetworkX, a Python module specifically for creating graphs. But NetworkX doesn't draw the graph, it only creates connections between nodes and edges and provides coordinates for everything. To draw it, I needed to use another library. I started off following the NetworkX docs and using Matplotlib, was simple and allowed me to generate simple graphs quickly.
A simple graph with two nodes (A, B) connected by an edge (A-B) can be created like this:
G = nx.Graph()
G.add_node("A")
G.add_node("B")
G.add_edge("A", "B")
nx.draw(G, with_labels=True)
matplotlib.pyplot.show()
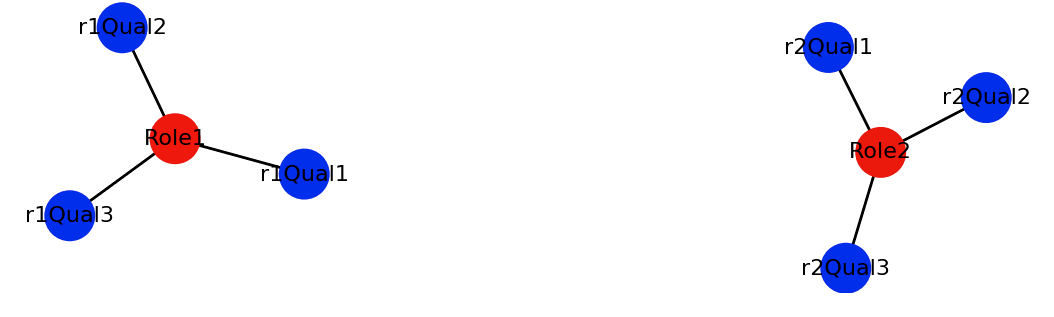
So, I represented roles and qualifications by nodes, and the connection by edges. So a each role would have a few qualifications connected to it:
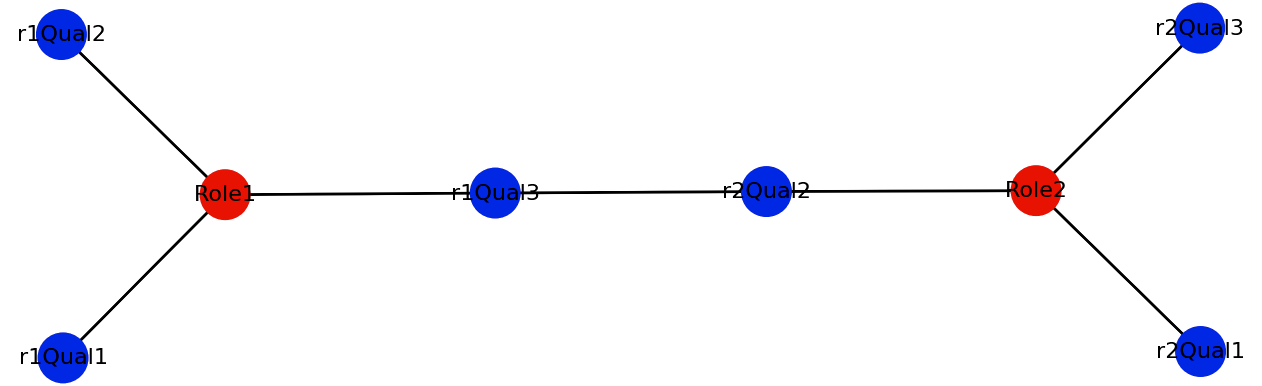
Now, if qualifications from different roles were exactly the same or similar (had a Jaccard distance < 0.1), I'd want to link them together:
To do the actual comparison:
for qx in role.qualifications:
    for qy in comparison.qualifications:
        l, j = compare_two_sentences(qx, qy)
        if j < 0.15:
            G.add_edge(role.title, qy)
        else:
            G.add_node(qx)
            G.add_edge(role.title, qx)
Now, you may be wondering why I'm adding nodes as I did the comparison instead of generating all nodes (roles, qualifications) and edges (role𝑥←→qualification𝑦) first, then comparing and linking the similar qualification nodes. The issue was that if two or more qualifications from different nodes were exactly the same, and there were similar qualifications found, I'd only be able to add edges to the first one in the node list unless I also added unique IDs to the nodes. I implemented this the way I did out of laziness since I wanted to see results quickly:
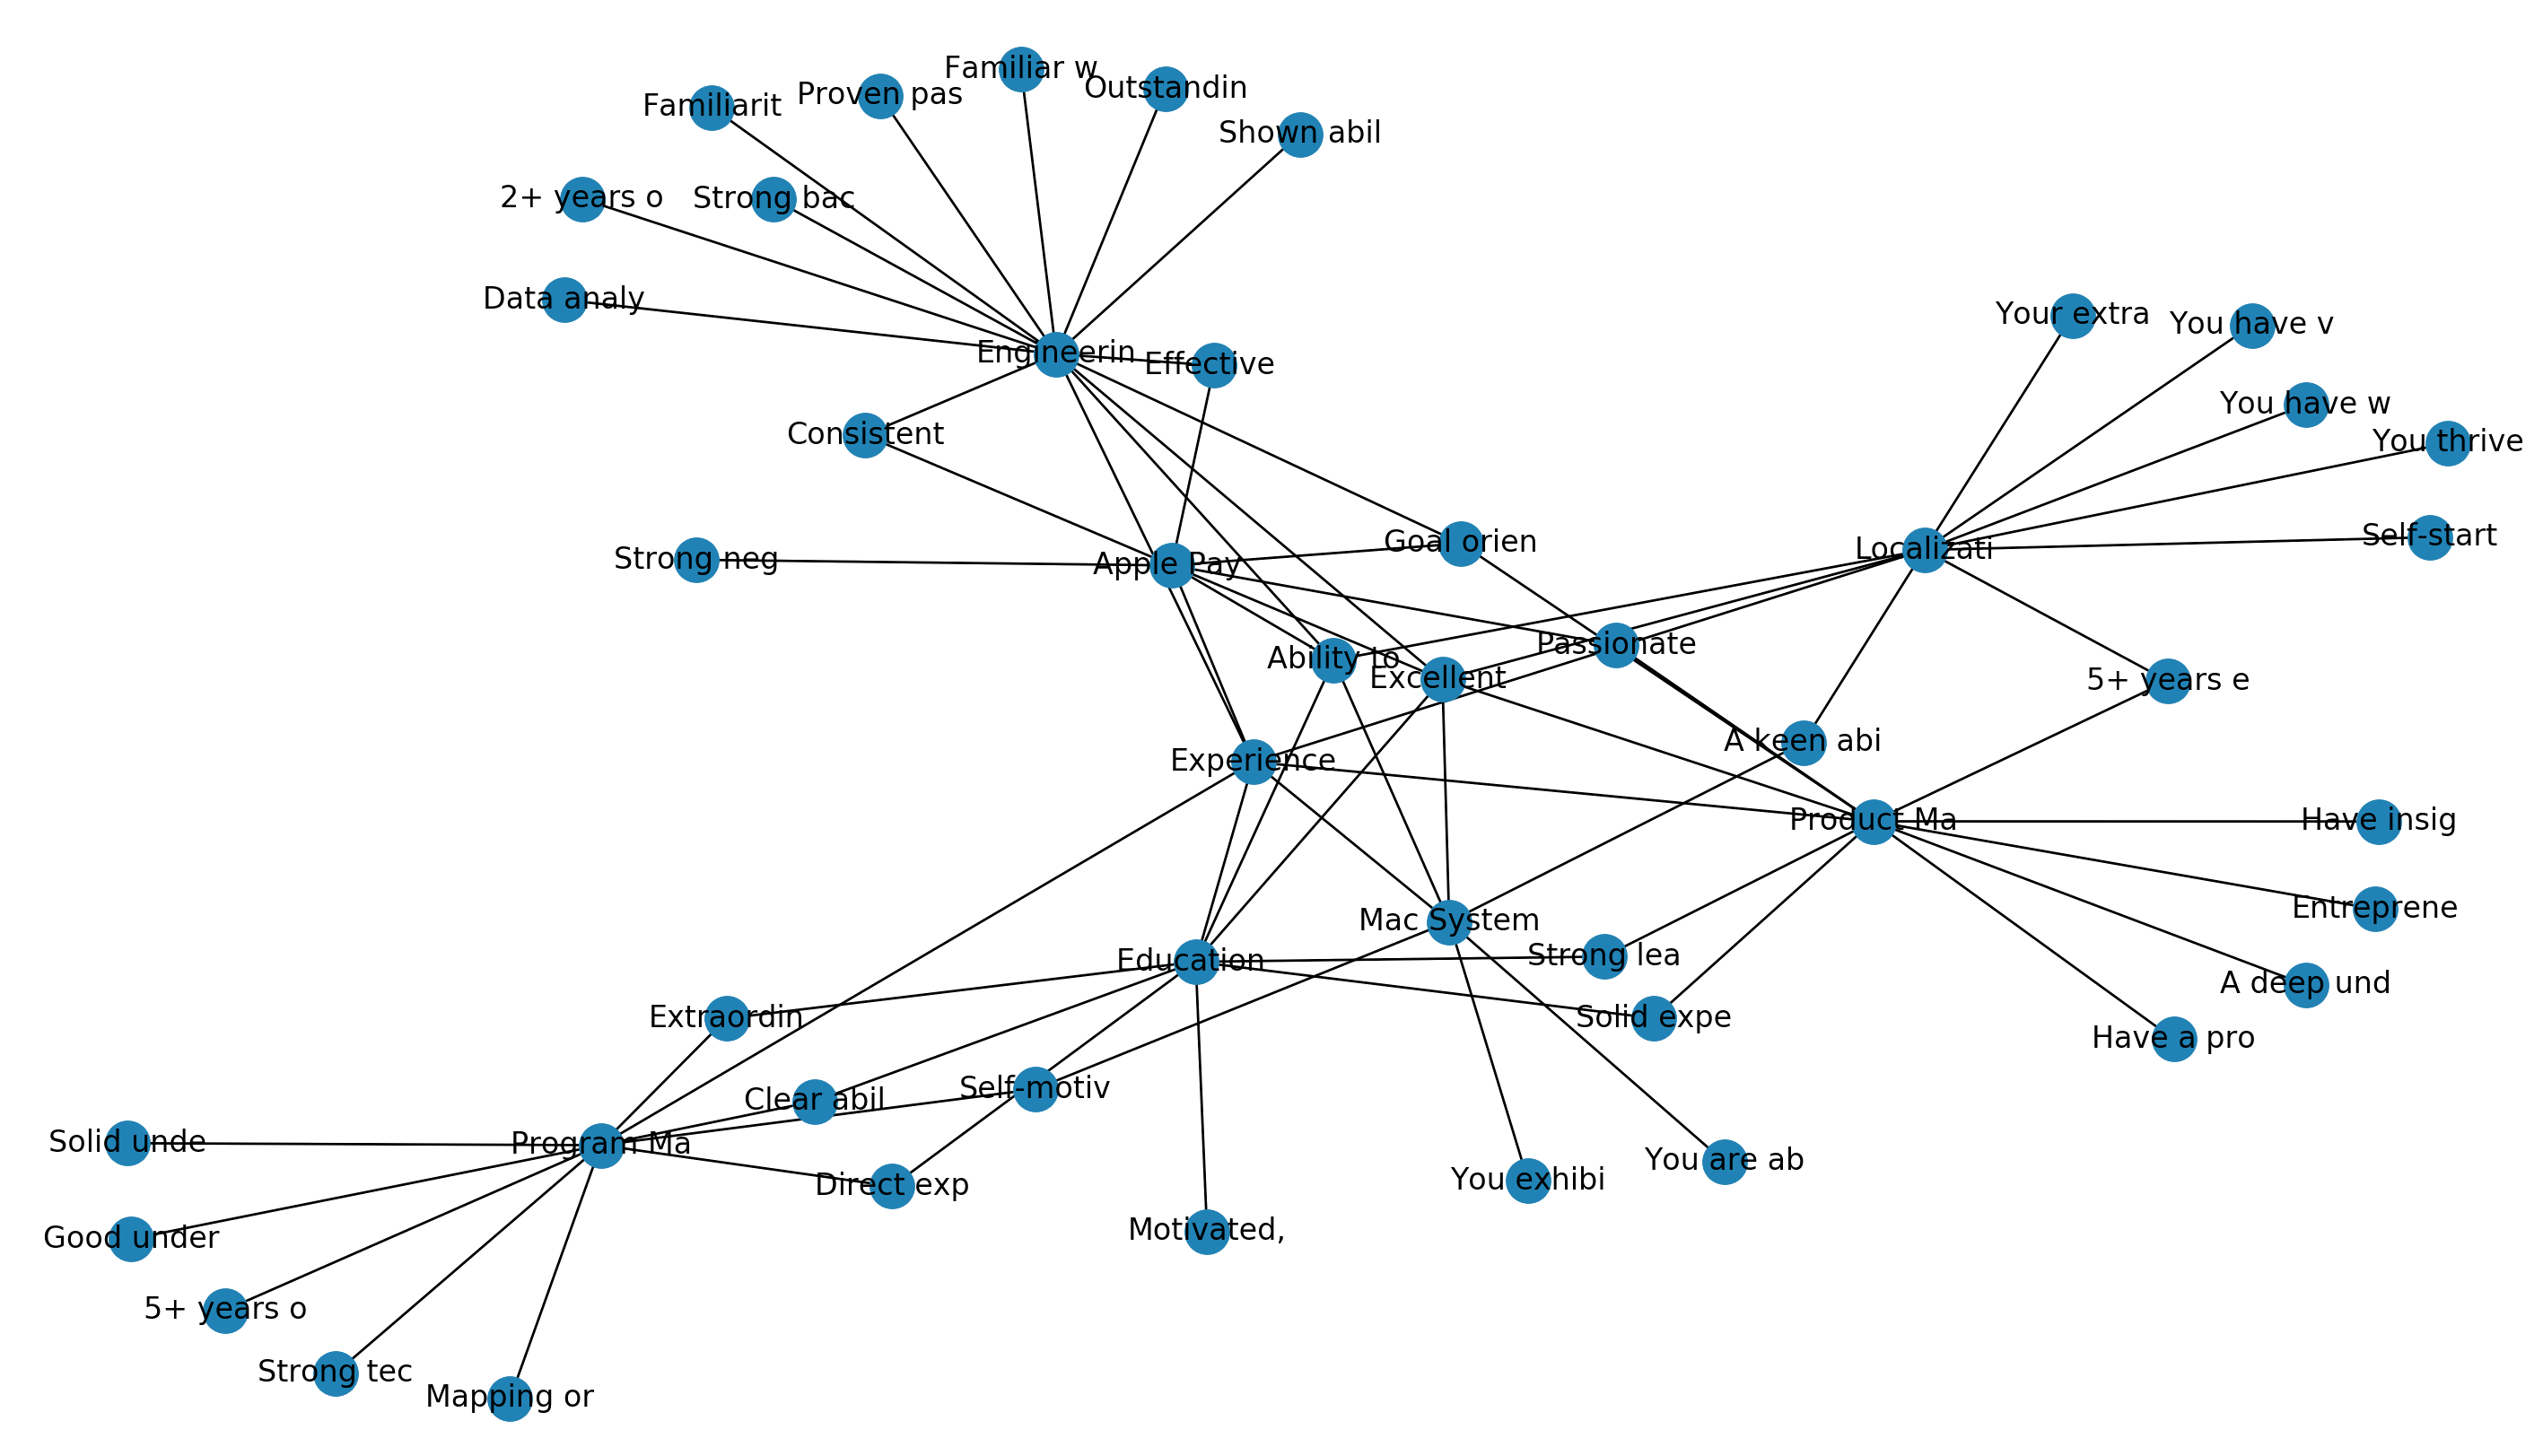
So, it's clear that some of the qualifications are similar between roles. But the graph was pretty ugly (especially since I had to truncate the qualifications to make them fit). I tried a bit more with Matplotlib but eventually implemented Plot.ly:
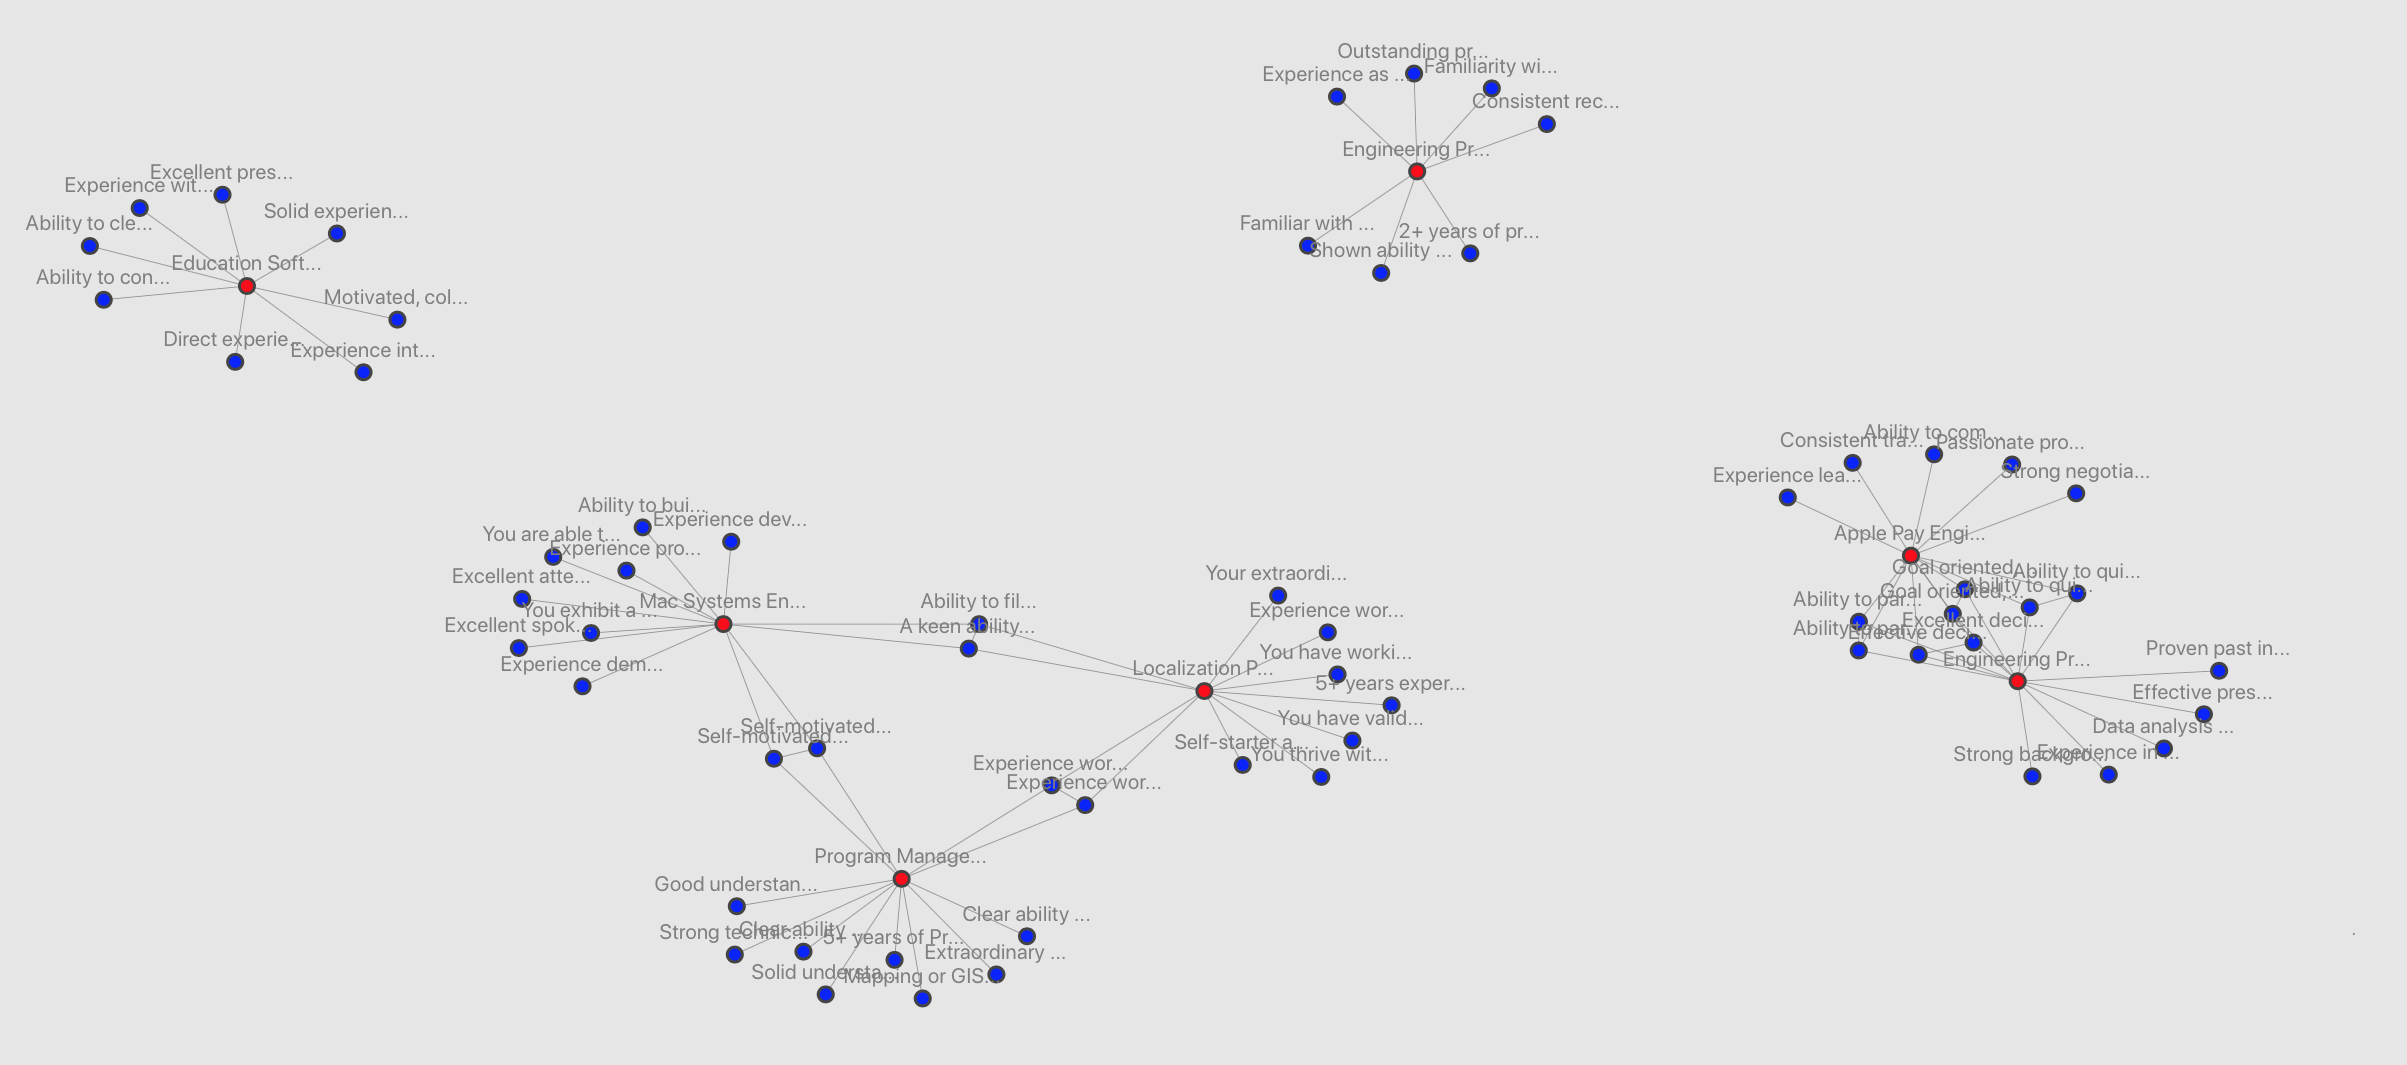
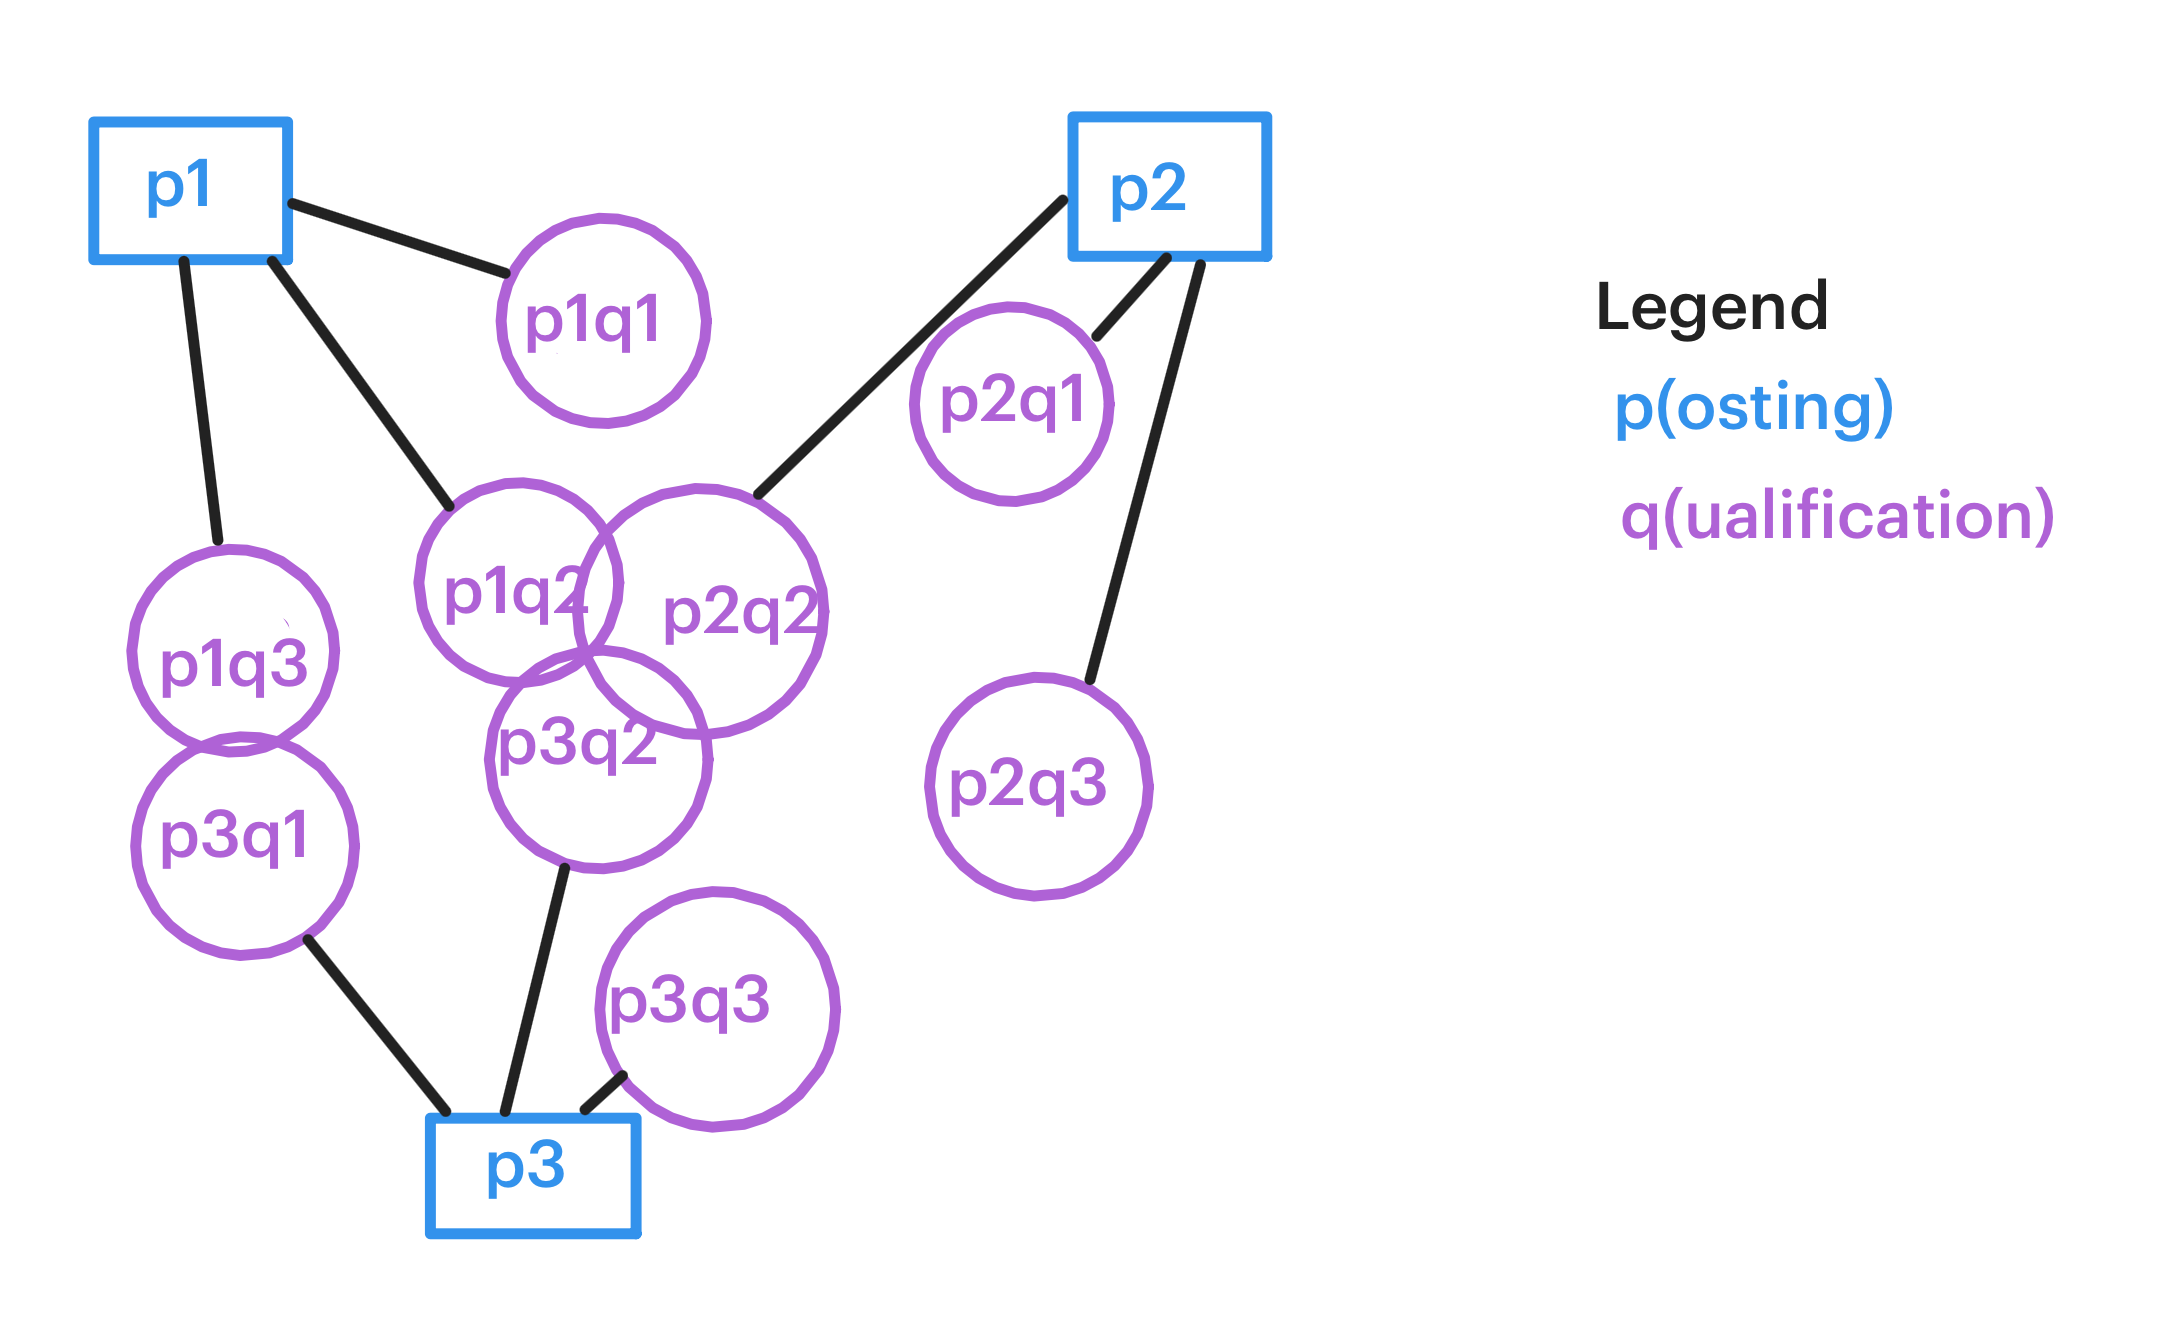
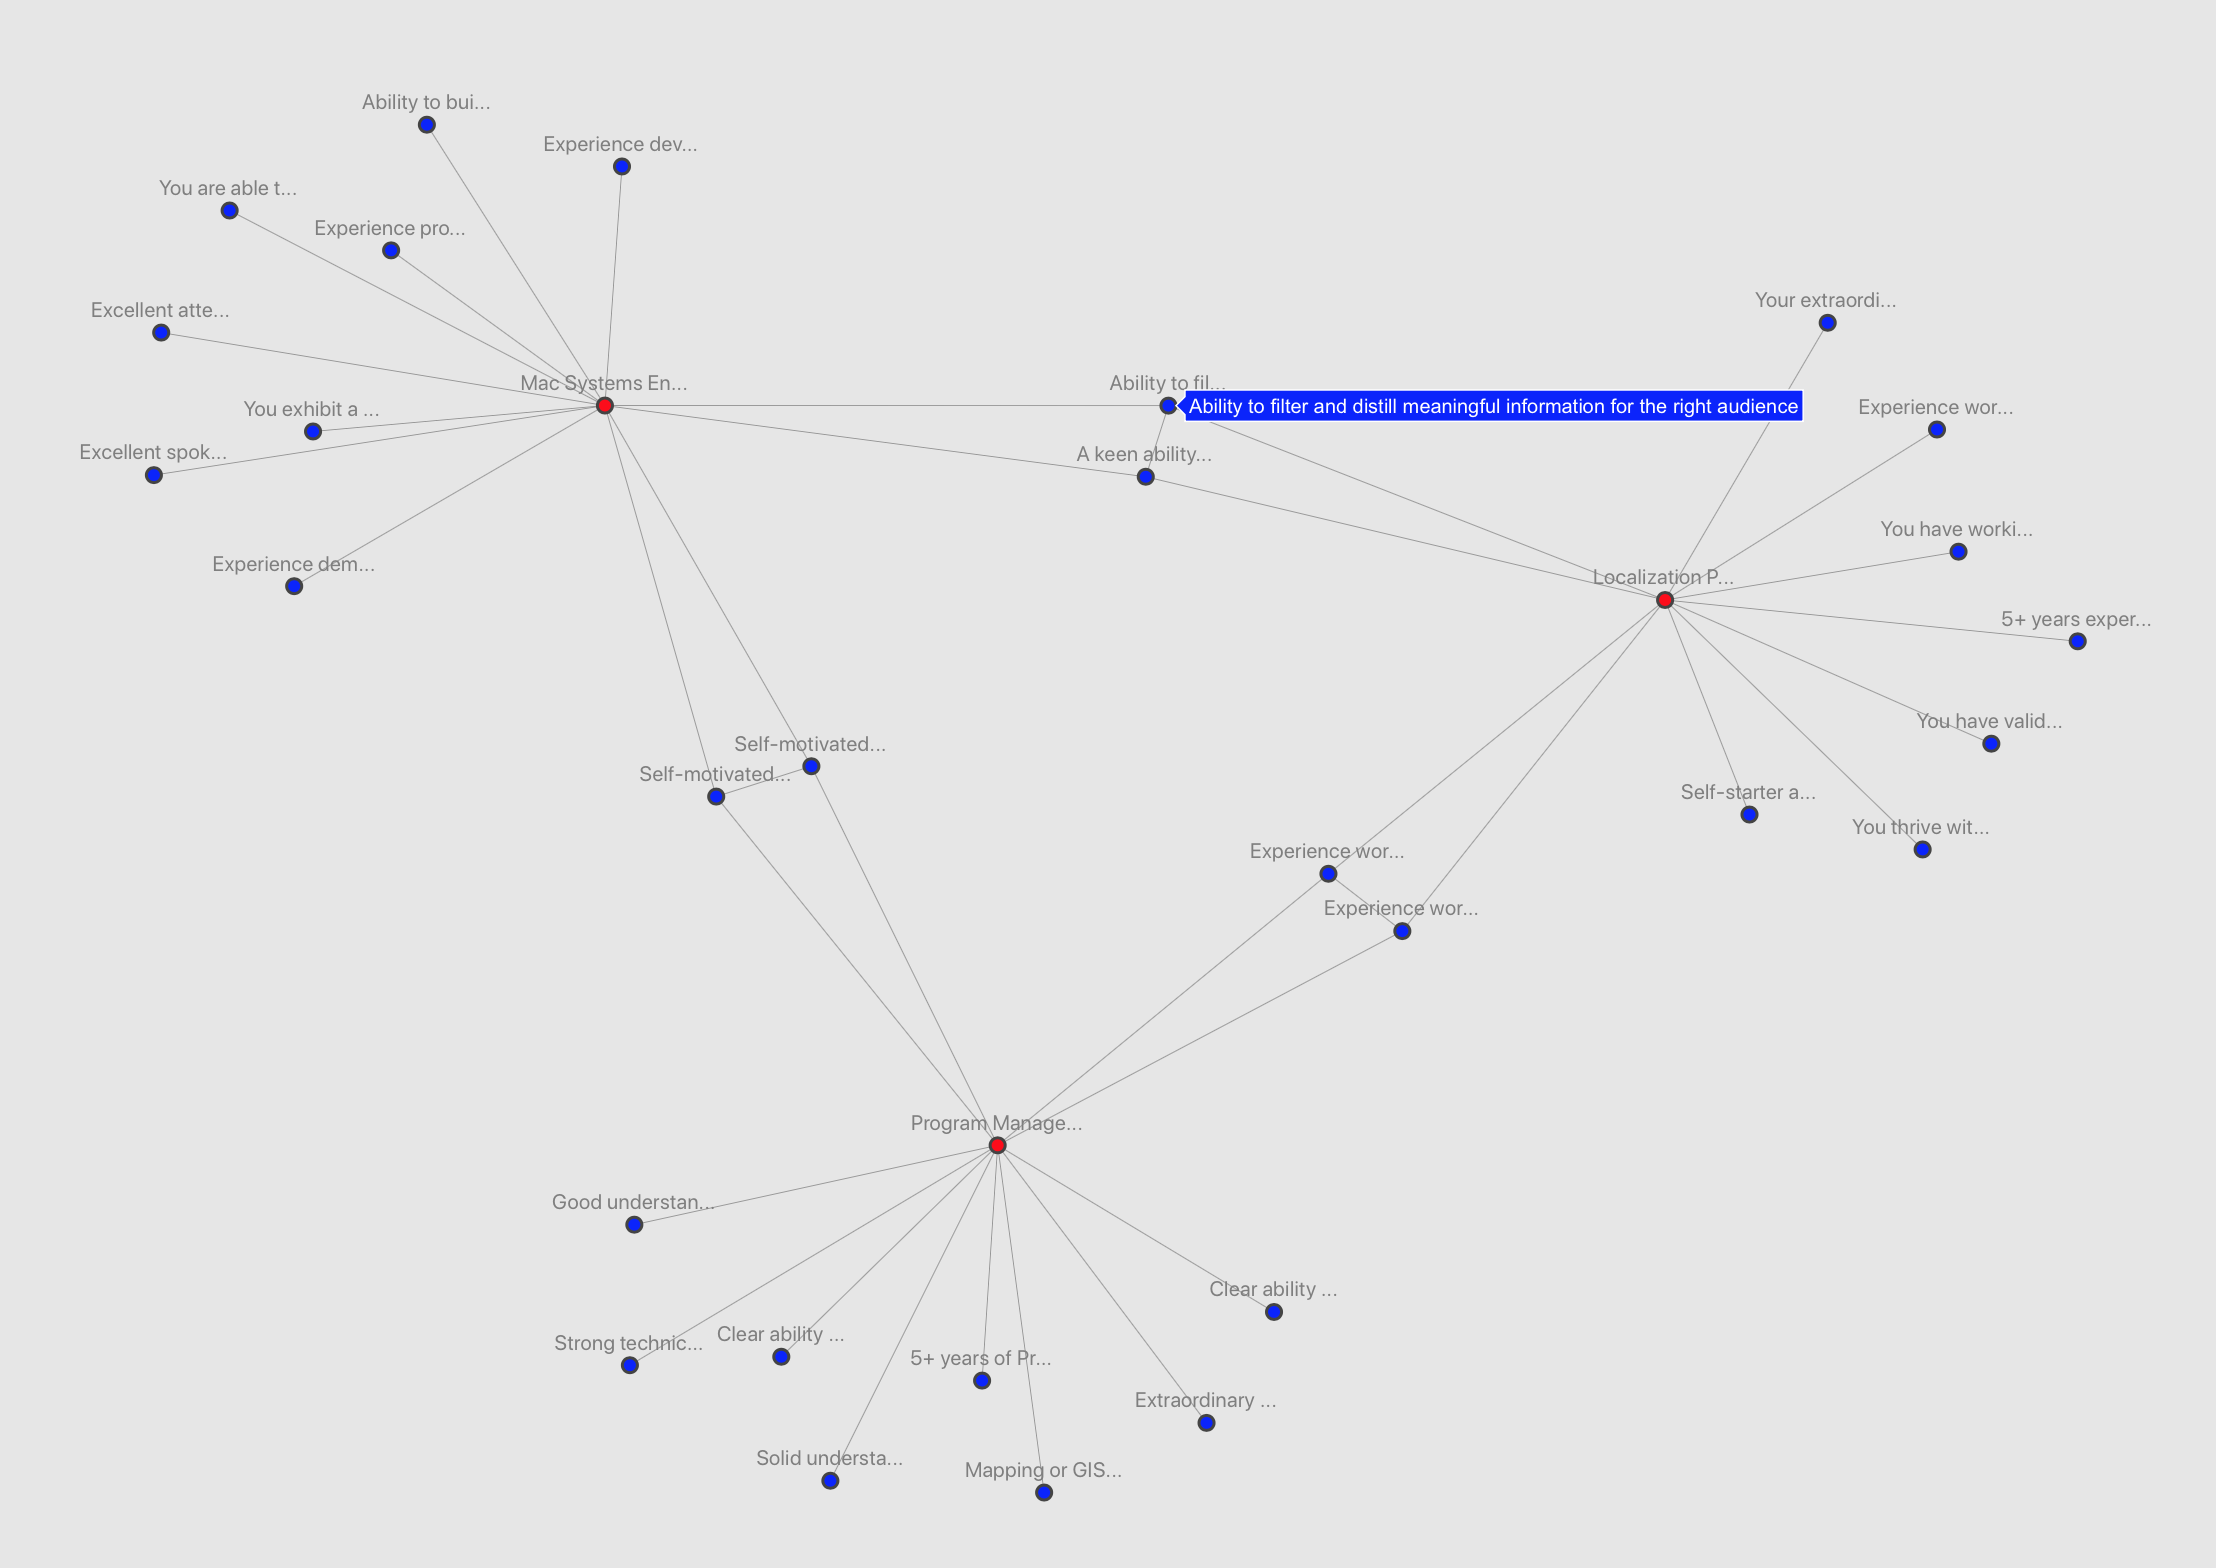
As expected, similar qualifications are linked together and it's easy to see the overlap between roles. Here's a sample of a triangle of roles with overlapping qualifications. Mousing over each node reveals the full qualification:
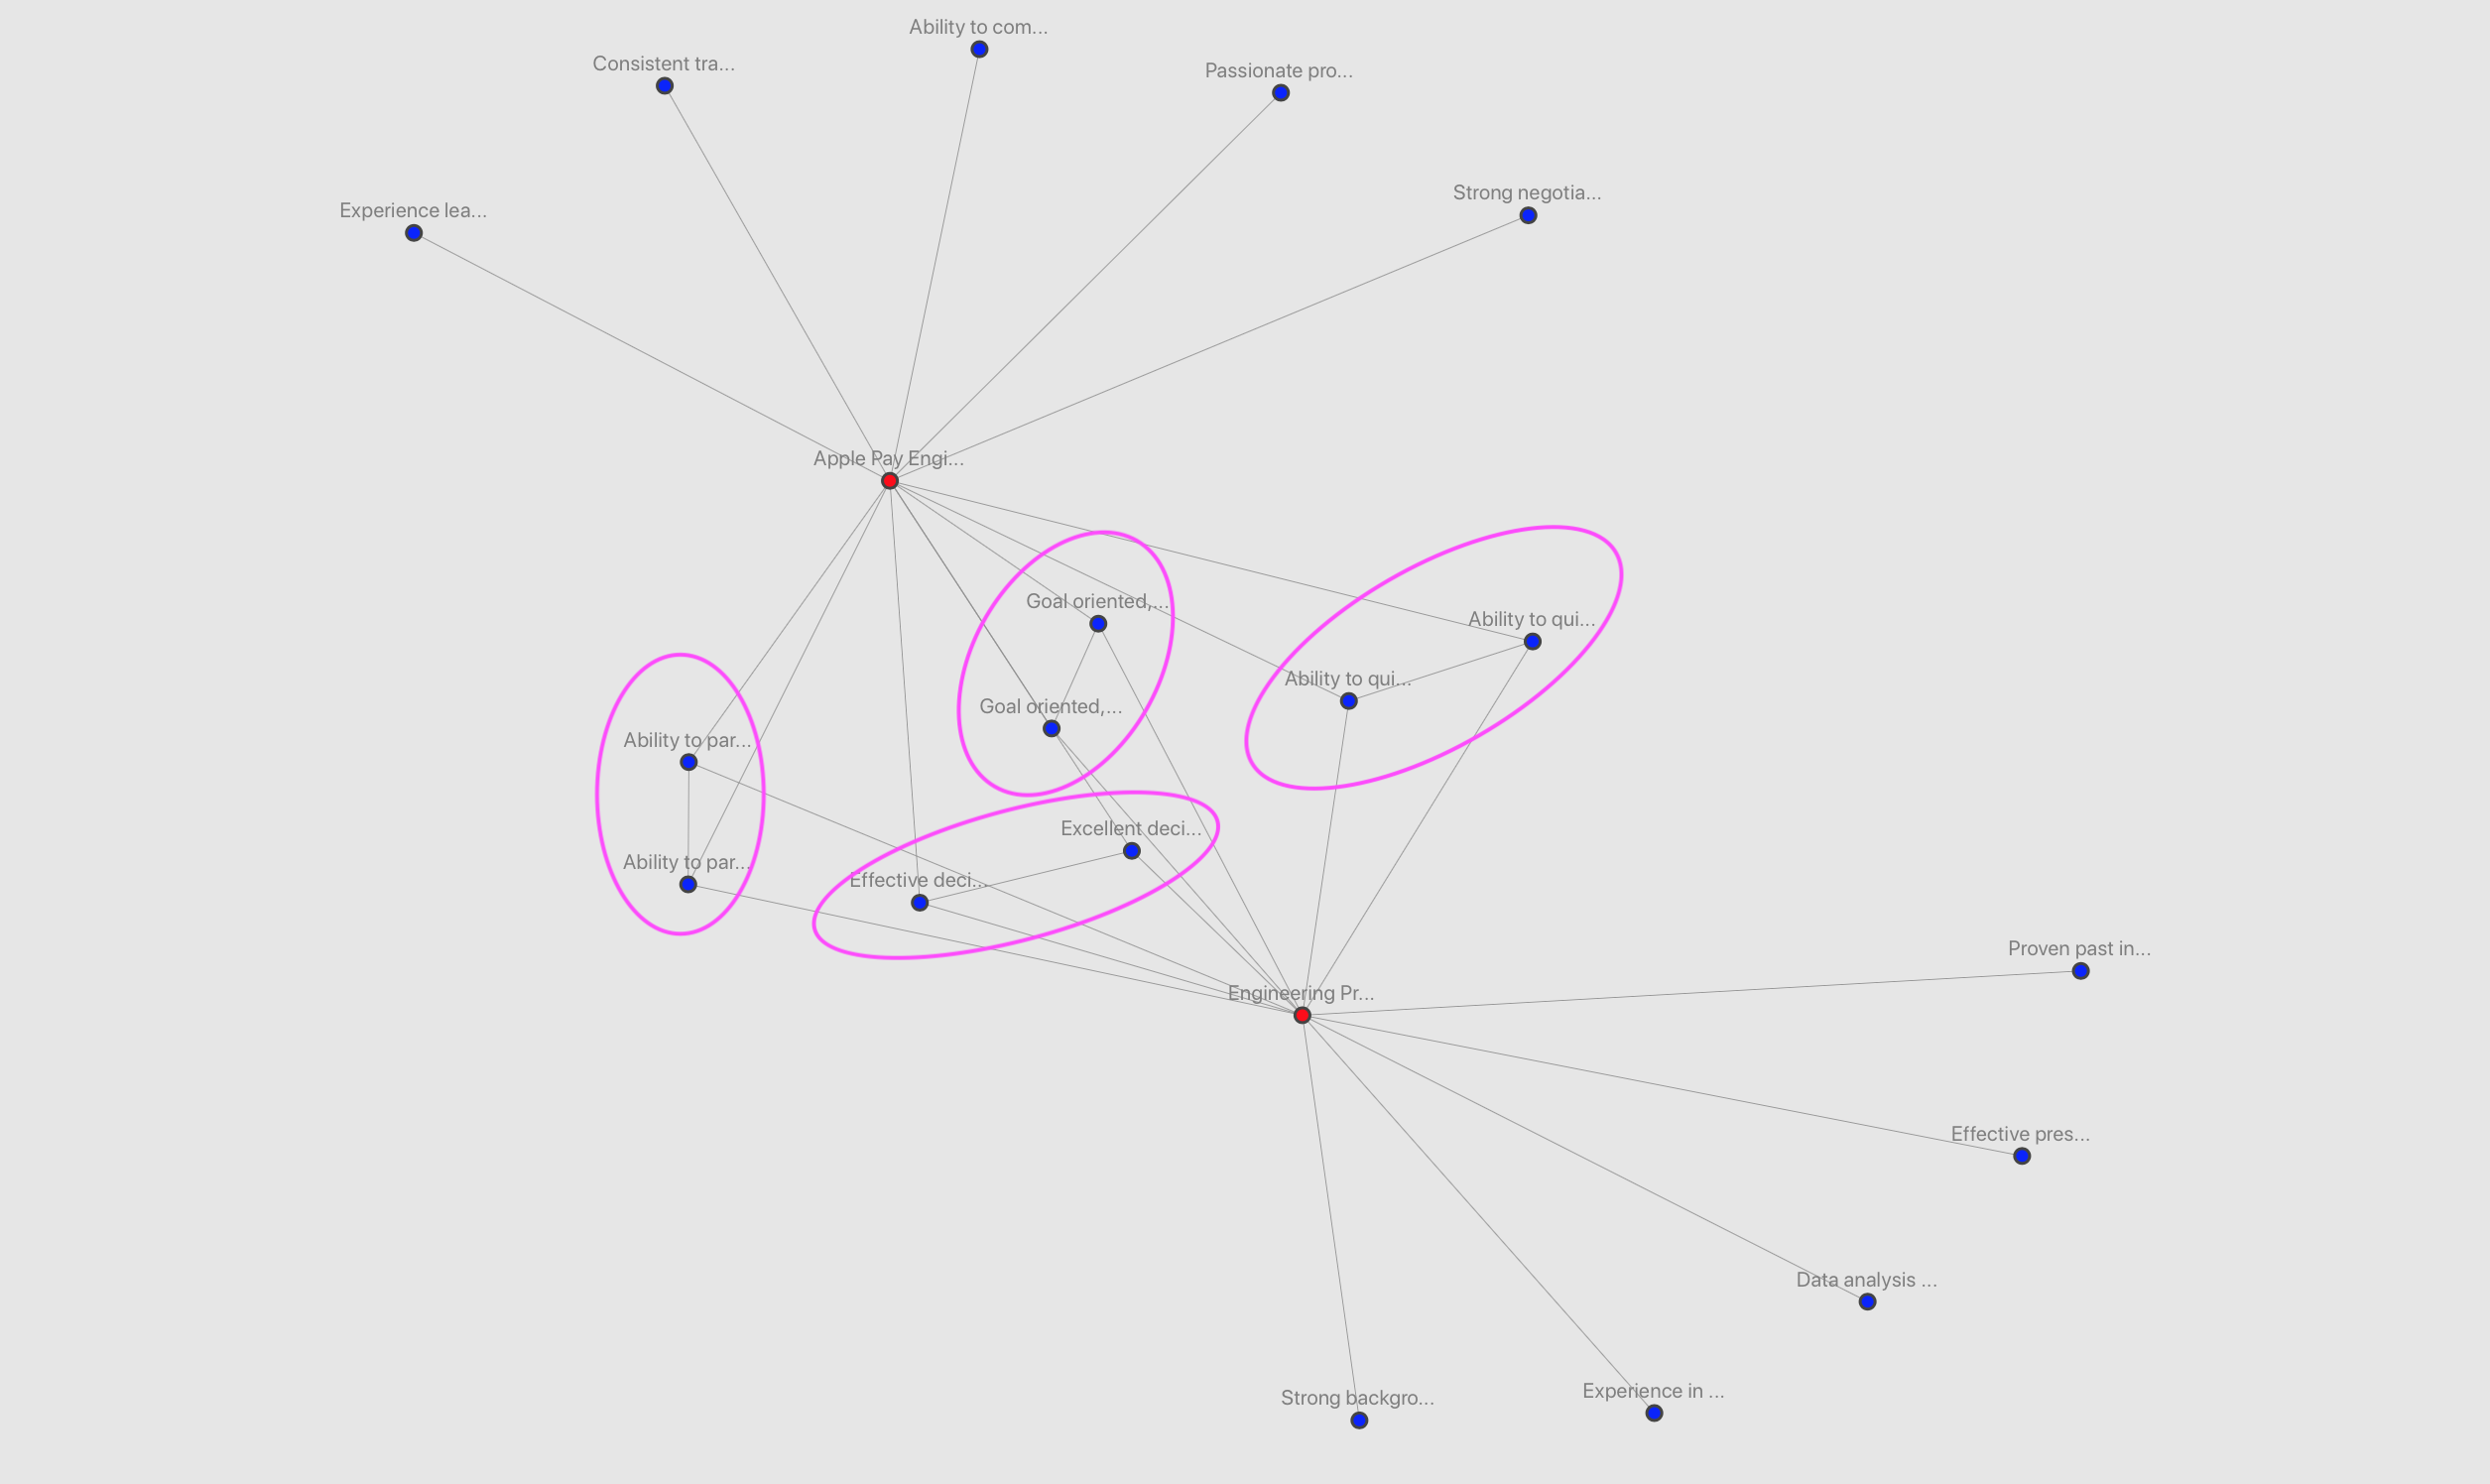
Some roles have even more overlap of qualifications. This is a bit more difficult to read since I haven't figured out a way to group the nodes, or to prevent lines from crossing each other (using this type of graph):
Result
Of course, improving legibility and making it easier to understand connections can still be worked on. But it's easy to see that some roles have more overlap than others. At the same time, some qualifications say so much that they might as well be describing every role, like this: "Goal oriented, highly motivated and able to work under minimal supervision in a cross-functional environment at detailed levels whilst taking account of interdependencies at higher levels".
Still, it's useful to see if some roles more heavily overlap with others. One could apply to groups of similar roles without modifying their resume and/or cover letter, increasing application efficiency.
Here's the full Plot.ly output if interested (select groups to zoom in and inspect, mouseover a node to view full role or description):
Next Steps
There are more important things one can do that improve their chances at landing a role. However, this was still an interesting learning experience.
- Add additional careers sites from different companies to see how qualifications differ between similar or exact match job descriptions
- Instead of using relatively simple Levenshtein and Jaccard distance, use TensorFlow Hub and use the Universal Sentence Encoder
- Try different ways of displaying the data (3D layout, different graph types, etc.)