Forecasting Completion
(Photo: Point Bonita with SF Ocean Beach in the background)
TLDR: You can use my calculator to forecast completion intervals here: Monte Carlo calculator
There are two ways of estimating how long software will take:
1. Have developers and managers think deeply about the problems and apply their best guesses based on what they've seen in the past.
2. Sample how long it actually takes that particular team to finish work items and extrapolate the future.
This article covers the second method, specially using probabilistic forecasting (Monte Carlo) to create a graph showing the likeliness of completion at specific points in time.
The main benefit of this is that it allows you to specify a range of completion dates with comfidence, instead of just a single date.
Instead of: it will be done in 10 weeks
You can say: there's a 50% it will be done in 7 weeks, and 90% chance it'll be done in 10 weeks
Prerequisite: you need existing data (work items) from existing person, team, or whatever you are trying to measure. This method can't be used to forecast the future without past data. I'll use some entirely made up data first for a chat application. Interval can be any duration (days, weeks, sprints), but must be consistent.
Gather data
Here's a table of work items that have been completed thus far.
| id | work item | how long it actually took |
|---|---|---|
| 1 | Project setup | 1 |
| 2 | User auth | 2 |
| 3 | User profiles | 1 |
| 4 | Contact list | 1 |
| 5 | Chat data model | 1 |
Below is a table of work items that have not been completed (To Do list). It's hidden because the work items aren't actually important, the only thing that matters is the count of remaining items (in this case, 10).
Show table
| id | work_item |
|---|---|
| 6 | Messaging UI |
| 7 | Notifications |
| 8 | Search |
| 9 | File uploads |
| 10 | Permissions |
| 11 | Settings |
| 12 | Admin dashboard |
| 13 | Logging & monitoring |
| 14 | Deployment |
Note:
- The To Do list doesn't have estimates about how long things will take
- We will assume every work item will take about the same amount of time/have the same size
- If anything is obviously more complex than the average, those items should be broken down
- We don't actually care about the names of any of the remaining work items (only the count)
Run simulation
I used to use a Google Sheet + Python script to do this. Now I have a simple single-page HTML file that does it in JavaScript.
Collect history: take the durations of completed items (1,2,1,1,1) intervals.
Count what’s left: how many items remain (10). These have no estimates. For the purposes of the simulation, each remaining item is assumed to be roughly the same size as an average completed item.
One run:
- For each remaining item (in this case, 10 items), pick one past duration at random
- Add them up → that’s the simulated remaining time
Here's some Python code that shows how this works
Show Python code
import random

completed = [1, 2, 1, 1, 1]   # intervals for done items
remaining_items = 10

remaining_intervals = 0

for i in range(remaining_items):
    sampled_duration = random.choice(completed)
    print("sampled_duration: %s" % sampled_duration)
    remaining_intervals += sampled_duration
    print("remaining intervals: %s" % remaining_intervals)

print(remaining_intervals)
Or run the JS version directly
Now the fun part 🎉... Monte Carlo
- The simulation is run many times (≈1000 runs is more than sufficient)
- Each run represents one plausible future
- The collection of results forms a distribution of possible completion times
Toggle for a 5 run sample
| run # | remaining intervals |
|---|---|
| 1 | 9 |
| 2 | 9 |
| 3 | 10 |
| 4 | 12 |
| 5 | 14 |
From that distribution, we can read:
- P50: a coin-flip completion time, in this case 10 intervals
- P80: a "reasonably safe" completion time, in this case 11 intervals
- P90: a "very safe" completion time, in this case 12 intervals
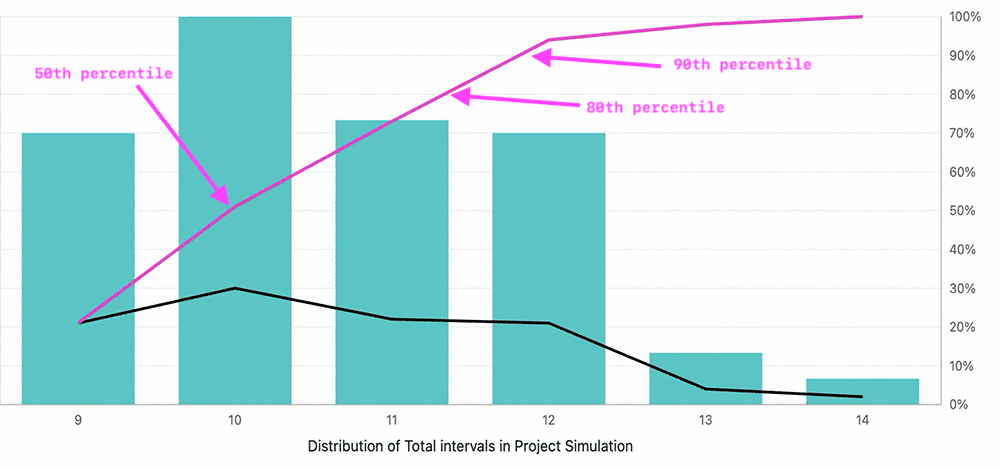
Screenshot from my Monte Carlo calculator.
Instead of a single guess, this gives a range of outcomes and the probability of hitting each one.
So you can tell your CEO that there's a 50% chance of completing the remaining work in 10 intervals, and a 90% change of completing in 12 intervals.
Real Examples
①
Jira backlog of 96 items. 24 items already completed (with ranges from 1-5 weeks per item). How long would this backlog take to clear assuming the same team and no new items?
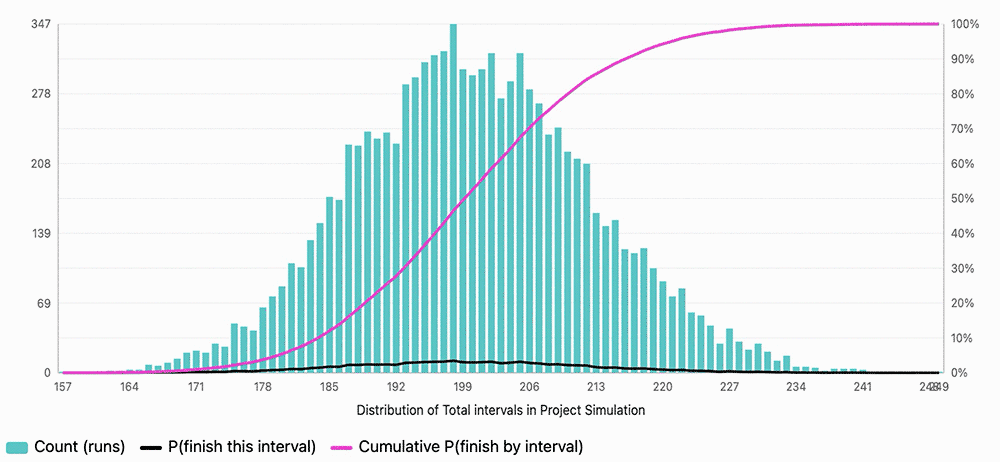
Result: 50% chance in 2.8 years (150 weeks), 80% chance in 3.8 years (200 weeks)
In reality, there was 0 chance of having the same team for 3 years straight, nor not adding any more backlog items. The result of this was showing how dire the situation was and that a backlog item cleanup was necessary.
②
Halfway point in a program, with 45 items remaining, 44 items already completed, with ranges in days from 1-40. How long would the remaining items take to clear assuming the same team and no new items?
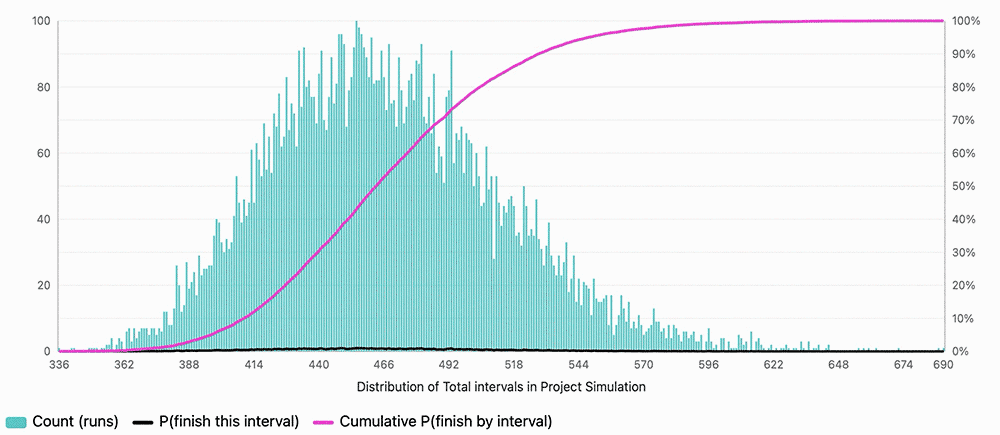
Result: 50% chance in 1.2 years (460 days), 80% chance in 1.4 years (505 days)
In reality, this project was already over the initial target date by a year, so an additional 1.2-1.4 years wasn't acceptaible to the primary stakeholders. The initial target date was estimated using typical estimation process.
The project ended up being re-scoped and simplified. If this forecasting wasn't done, it likely would have continued on the same delayed path for much longer.